Phone comparison · UK prices · October 2026
Pixel 10 Pro or Galaxy S26+: which should you buy?
The short answer
The Pixel 10 Pro leads on the screen and the camera, and is smaller. The Galaxy S26+ leads on battery life, is thinner, and has the bigger screen. The Galaxy S26+ costs £455 more than the Pixel.
Comparing 2 phones
 Pixel 10 Pro
Overall score 88/100
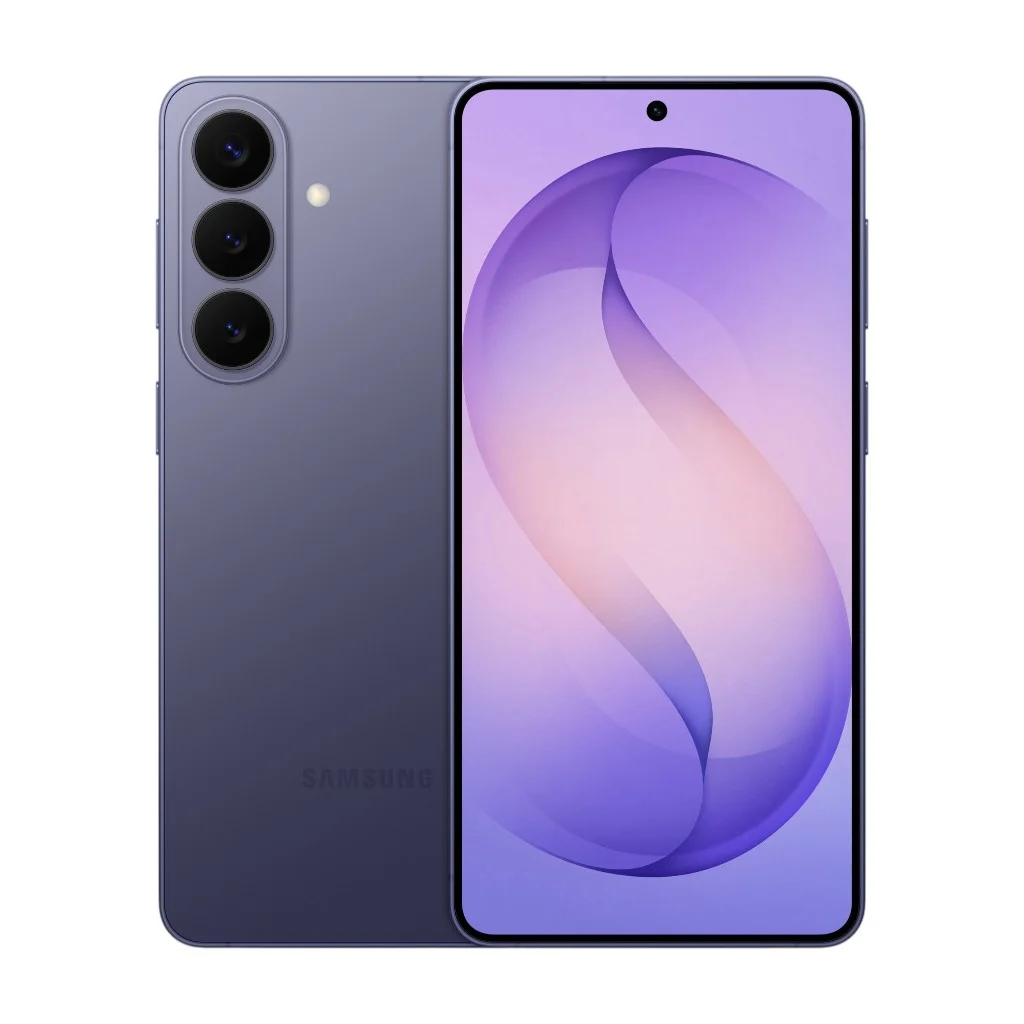 Galaxy S26+
Overall score 89/100
What the extra money buys
The Galaxy S26+ costs £455 more than the Pixel.
You get: faster charging by cable, faster wireless charging, a faster chip and a bigger screen.
You give up: a brighter screen, a longer zoom, a sharper selfie camera and more memory (RAM).
Worth it if you want faster charging by cable and faster wireless charging. Keep the money if a brighter screen matters more to you.
Differences in daily life
Battery and charging
Best: Galaxy S26+The Galaxy S26+ charges faster by cable (45 W vs 30 W on the Pixel), so it tops up quicker with a compatible charger.
It also charges faster without a cable (20 W vs 15 W on the Pixel), so cable-free top-ups are quicker.
Screen
Best: Pixel 10 ProThe Pixel 10 Pro has the brighter screen (3,300 nits vs 2,600 nits on the Samsung), so it is easier to read in strong sunlight.
Camera
Best: Pixel 10 ProThe Pixel 10 Pro's zoom lens reaches further (5x vs 3x on the Samsung), for closer shots of faraway subjects.
Its selfie camera also has more megapixels (42 MP vs 12 MP on the Samsung), so selfies and video calls can look more detailed.
Speed
Depends on youThe Galaxy S26+'s chip (Qualcomm Snapdragon 8 Elite Gen 5 (US and China), Samsung Exynos 2600 (International)) scores higher in benchmark tests than the one in the Pixel (Google Tensor G5), so it should feel quicker in demanding apps and games.
The Pixel 10 Pro has more memory (16GB vs 12GB on the Samsung), which helps it keep more apps open at once.
Size and weight
Depends on youThe Pixel 10 Pro is smaller overall (152.8 × 72 mm vs 158.4 × 75.8 mm on the Samsung), so it is easier to reach across with one hand.
The Galaxy S26+ has the bigger screen (6.7 inches vs 6.3 inches on the Pixel), which gives more room for videos, maps and reading.
Still can't decide?
Up to 3 quick questions, one tap each.
Scores
| Score | Pixel 10 Pro | Galaxy S26+ |
|---|---|---|
| Battery | 71 | 74 |
| Screen | 93 | 92 |
| Camera | 95 | 89 |
| Speed | 80 | 94 |
| Toughness | 92 | 92 |
| Connections and extras | 95 | 95 |
| Overall | 88 | 89 |
How these scores are made: Each score is calculated from the maker's published specs and benchmark results, using one fixed formula for every phone. We have not tested these phones in the hand. How we score phones
Specs side by side
Display
- Type
- LTPO OLEDDynamic LTPO AMOLED 2X
- Size
- 6.3 inches6.7 inches
- Resolution
- 1280×2856 pixels1440 × 3120 pixels
- PPI
- 495516
- Aspect ratio
- 20:919.5:9
- Screen-to-body ratio
- 87.6 %90.7 %
- Display features
- Capacitive Touchscreen HDR10+ Multi-touch displayCapacitive Touchscreen, HDR10+, Multi-touch display
- Max rated brightness
- 3300 nits2600 nits
- Screen protection
- Corning Gorilla Glass Victus 2, Mohs level 4Corning Gorilla Glass Victus 2, Mohs level 5
Core Specifications
- Chipset
- Google Tensor G5Qualcomm Snapdragon 8 Elite Gen 5 (US and China), Samsung Exynos 2600 (International)
- CPU cores
- 88 (US and China), 10 (International)
- Fabrication Technology
- 3 nm3 nm (US and China), 2 nm (International)
- CPU max frequency
- 3780 MHz4.6 GHz (US and China), 3.8 GHz (International)
- Microarchitecture
- 1x 3.78 GHz – Cortex-X4 5x 3.05 GHz – Cortex-A725 2x 2.25 GHz – Cortex-A5202x 4.6 GHz – Oryon V3 Phoenix L, 6x 3.62 GHz – Oryon V3 Phoenix M (US and China), 1x 3.8 GHz – C1-Ultra 3x 3.25 GHz – C1-Pro 6x 2.75 GHz – C1-Pro (International)
- GPU
- IMG PowerVR DXT-48-1536Qualcomm Adreno 840 @1.20 GHz (US and China), Samsung Xclipse 960 @985 MHz (International)
- RAM
- 16GB12GB
- Storage
- 128GB, 256GB, 512GB, 1TB256GB, 512GB
- Expandable Storage
- N/ANo
Software
- Operating System
- Android 16 (Baklava) , with up to 7 major Android upgradesAndroid 16 (Baklava), with up to 7 major Android upgrades
Main Camera
- Video Resolution
- 4320p @ 30 fps 2160p @ 24/30/60 fps 1080p @ 24/30/60/120/240 fps4320p @ 24/30 fps, 2160p @ 30/60 fps, 1080p @ 30/60/120/240 fps
- Video Features
- 10-bit HDR, Gyro-EIS, Optical Image Stabilization (OIS)10-bit HDR, Gyro-EIS, HDR10+, Stereo Sound Rec
- Features
- PanoramaAuto-HDR, Best Face, Horizon Lock, Panorama
- Lenses
- 50 MP , ƒ /1.7, 25 mm ( Wide-angle ), 1.2 μm , 1/1.31" Sensor size - Dual-Pixel PDAF - Optical Image Stabilization (OIS) 48 MP , ƒ /2.8, 113 mm ( Periscope telephoto ), x5 optical zoom, 1/2.55" Sensor size - Dual-Pixel PDAF - Optical Image Stabilization (OIS) 48 MP , ƒ /1.7, 123° ( Ultra-Wide angle ), 1/2.55" Sensor size - Dual-Pixel PDAF50 MP, ƒ/1.8, 24 mm ( Wide angle ), 1.0 μm, 1/1.56" Sensor size, - Optical Image Stabilization (OIS), - predictive dual pixel PDAF 10 MP, ƒ/2.4, 67 mm ( Telephoto ), 1.0 μm, x3 Optical zoom, 1/3.94" Sensor size - Optical Image Stabilization (OIS) - PDAF 12 MP, ƒ/2.2, 13 mm, 120° ( Ultra-wide angle ), 1.4 μm, 1/2.55" Sensor size - Super Steady Video
Selfie camera
- Matrix
- 42 MP12 MP
- Lenses
- 42 MP , ƒ /2.2, 17 mm ( Ultra-Wide angle ) - PDAF12 MP, ƒ/2.2, 26 mm ( Wide angle ), 1.12 μm, 1/3.2" Sensor size, predictive dual pixel PDAF
- Video Resolution
- 2160p @ 30/60 fps 1080p @ 30/60 fps2160p @ 30/60 fps, 1080p @ 30 fps
- Video Features
- N/AHDR10+, High Dynamic Range (HDR)
- Features
- High Dynamic Range (HDR) Panoramapredictive dual pixel PDAF
General
- Announced
- Wednesday, 20 August 2025Wednesday, 25 February 2026
- Released
- Thursday, 28 August 2025Friday, 06 March 2026
Battery
- Capacity
- 4870 mAh4900 mAh
- Wired charging power
- 30W45 W
- Wireless charging power
- 15W20 W
- Fast charging support
- noYes
- Features
- Qi2 wireless charging, Reverse wired charging,Qi2.2 wireless charging, Reverse wireless charging, Wired charging from 0-69% in 30 min (as advertised)
Battery Life Test
- Browsing
- 16:34 hh:mmN/A
- Video watching
- 10:03 hh:mmN/A
- Playing games
- 10:25 hh:mmN/A
Design
- Height
- 152.8 mm158.4 mm
- Width
- 72 mm75.8 mm
- Thickness
- 8.5 mm7.3 mm
- Weight
- 207 g190 g
Network
- Network_5G bands
- 5G: n1 (2100), n2 (1900), n3 (1800), n5 (850), n7 (2600), n8 (900), n12 (700), n14 (700), n20 (800), n25 (1900), n26 (850), n28 (700), n29 (700), n30 (2300), n38 (2600), n40 (2300), n41 (2500), n46 (5200), n48 (3500), n66 (2100), n70 (2000), n71 (600), n75 (1500), n76 (1500), n77 (3700), n78 (3500), n79 (4700), n258 (26000), n260 (39000), n261 (28000 MHz)n1, n2, n3, n5, n7, n8, n12, n20, n25, n26, n28, n38, n40, n41, n66, n71, n75, n77, n78, n257, n258, n260, n261
- Network_4G bands
- LTE: b1 (2100), b2 (1900), b3 (1800), b4 (1700), b5 (850), b7 (2600), b8 (900), b12 (700), b13 (700), b14 (700), b17 (700), b18 (800), b19 (800), b20 (800), b21 (1500), b25 (1900), b26 (850), b28 (700), b29 (700), b30 (2300), b32 (1500), b38 (2600), b39 (1900), b40 (2300), b41 (2500), b42 (3500), b48 (3800), b66 (1700), b71 (600 MHz)b1, b2, b3, b4, b5, b7, b8, b12, b13, b14, b17, b18, b19, b20, b25, b26, b28, b29, b30, b32, b38, b39, b40, b41, b48, b66, b71
- Network_3G bands
- HSPA: 850 / 900 / 1700 / 1900 / 2100 / 800 MHzHSPA: 850 / 900 / 1700 / 1900 / 2100 MHz
- Network_2G bands
- GSM: 850 / 900 / 1800 / 1900 MHzGSM: 850 / 900 / 1800 / 1900 MHz, CDMA: 800 / 1900 MHz
Connectivity
- WiFi support
- Yes ( Wi-Fi 7 )Yes (Wi-Fi 7)
- USB ports
- USB Type-C 3.2,USB Type-C 3.2, DisplayPort 1.2, USB On-The-Go
- GPS features
- BDS, GALILEO, GLONASS, GPS (L1 & L5), NavIC, QZSSBDS, GALILEO, GLONASS, GPS, QZSS
- Wi-Fi features
- Tri-bandTri-band, Wi-Fi Direct
Multimedia
- Audio type
- Stereo speakers,High-bitrate audio support, Stereo speakers